
搜索到
2
篇与
的结果
-
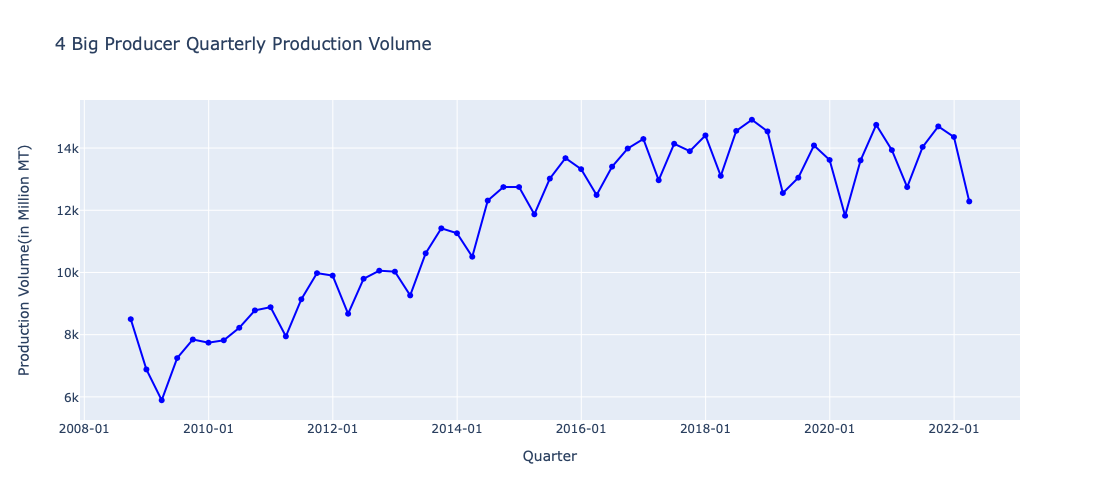
 iron ore Dalian future prices analysis-大连铁矿石期货价格规律研究-2024.8.31 Future price is the expectation of physical commodity price in future date.People use different methods to come up with forecasted prices. Similar to CME forecast, people could use Econometric Model, Economic Indicators, Checkinglist Approach. Based on observation, physical commodity price is mainly decided by the supply and demand imbalance. Iron ore supply is mainly decided by iron ore mining companies, while iron ore demand is mainly decided by steel factories. On the supply side, global iron ore production is about 2.7billion MT in 2021, and global iron ore export is about 1.6billion MT. Australia and Brazil accounts for about 50% of total production and 77% of total export. which On the demand side, global iron ore consumption is about 2.6 billion MT in 2021 and global iron ore import is about 1.6bilion MT. China account for 60% total iron ore consumption and 73% of iron ore imports.Total iron ore supply volume could be measured by two ways: 1.miners' total production; 2. miners' production plus miners' inventory plus cargoes on the sea plus inventory on ports plus inventory in steel mill. Followings are detailed data regarding these two ways to evaluating total iron ore supply.These data are based on 4 big producers(Vale, BHP, Rio, FMG)'s anual report. These are lagging indicators for iron ore total supply, since it is about 4 month later than the real production. There are also leading indicator on iron ore production, that is capex of producers.Based on these capex, we can calculate the incremental iron ore production volume for coming years and hence calculate the total iron ore suply volume in coming years. After we have the global iron ore supply numbers, we will calcuate the iron ore demands numbers in the similar way. Since there is no direct iron ore demands numbers, we need to calculate the iron ore demands numbers from pig iron or crude steel production volumes and reverse the manufacturing process to get the iron ore numbers. For the incremental iron ore demands numbers, we could use incremental world steel capacity increase to calculate. However, there is no incremental steel capacity numbers available neither. So I have to estimate the world crude steel production volume based on historical data as well as on global GDP growth number. When I looked into the global gpd growth data from IMF and WorldBank, I didn't find correlation between global GDP growth rate and global crude steel production change rates. So I used historical average crude steel production growth rate in last 5 years to predict the future global crude steel production. Then we derive the global iron ore demands from global steel production volumes.After we have both iron ore production and demands forecast, we can calculate the iron ore production and demands gap as well as the potential iron ore end stocks for each year. Based on the iron ore supply and demands gap and seasonality of iron ore price, we can do raw iron ore price forecast for year as well as for month.These are the basic theory. Based on above theory, we can try to evaluate how the current future market price comparing with the mighty physical price.If we try to make some profit, we will need to design our trading plan.The trading plan including two dimension: price and volume. We will need to decide what volume will be build at what price.
 -
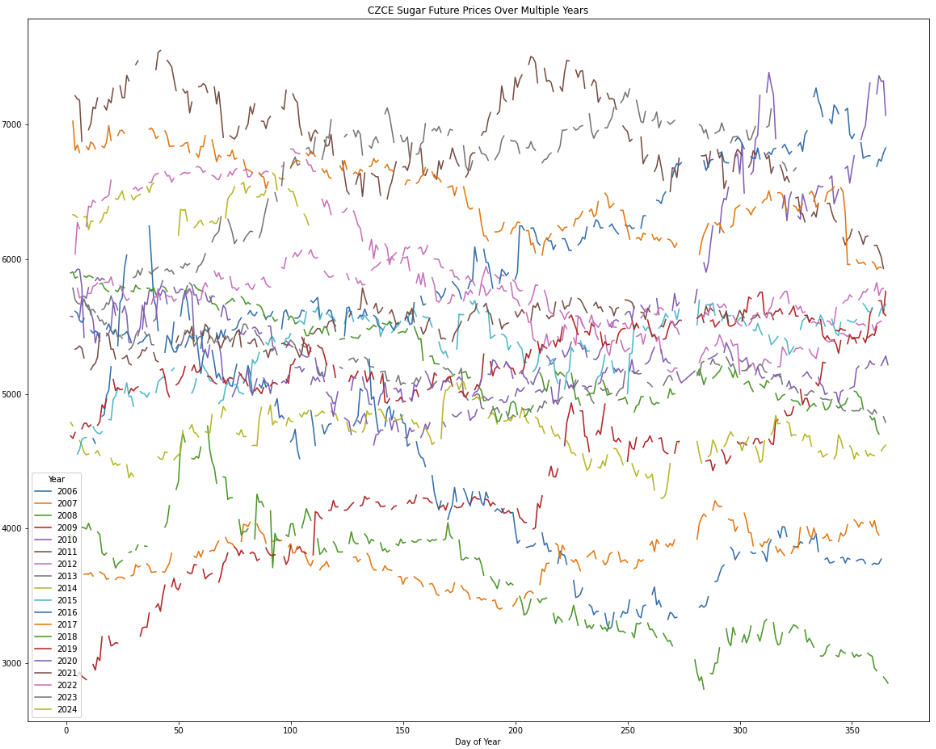
Sugar_future_analysis_白糖期货研究 The sugar future prices are affected by four main factors:1. physical supply and demand gapfinancial supply and demand gappeople's expectationcapital availabilityThe relationship among prices and these four factors are:Future price = a + b1 physical_sd_gap + b2 financial_sd_gap + b3 expectation + b4 capital_avail + errorThe historical CZCE whitesugar chart are as following:Chart1 CZCE whitesugar active future priceThe historical ICE no.11 raw sugar chart are as following:Chart2 ICE no.11 raw sugar active future priceThese are the basic theory. Based on above theory, we can try to evaluate how the current future market price comparing with the mighty physical price. If we try to make some profit, we will need to design our trading plan.The trading plan including two dimension: price and volume. We will need to decide what volume will be build at what price.